Using a Midi controller
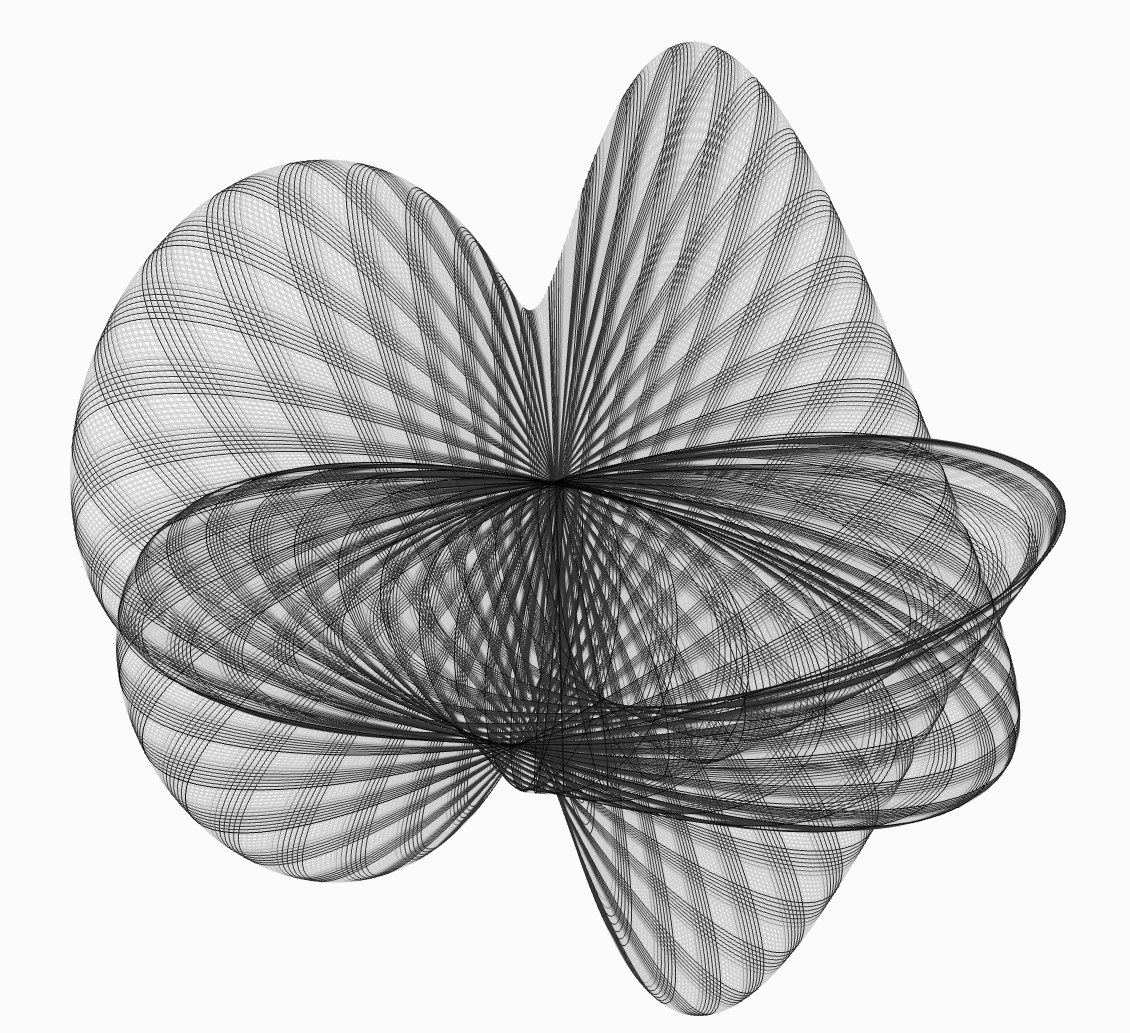
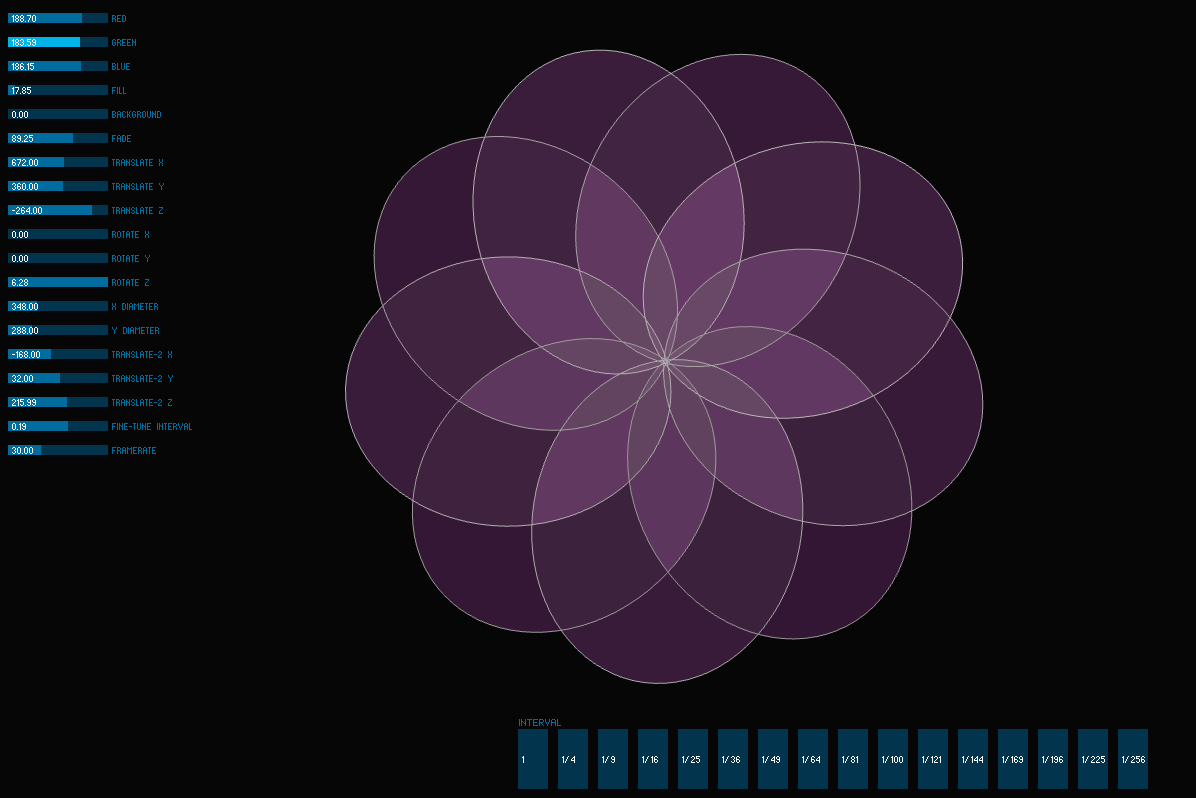
For this project, I was interested in exploring the resonances that emerge via the constructive self-interference of oscilating time-based patterns. In the same way that an audio synthesizer can produce an infinite variety of tones by combining simple waveforms, this application can be used to generate an infinite variety of patterns using only a single rotating ellipse. In the future I plan on expanding it with other visualizations, as well as adding the capacity to generate unique sounds along with the images, using the same parameters.
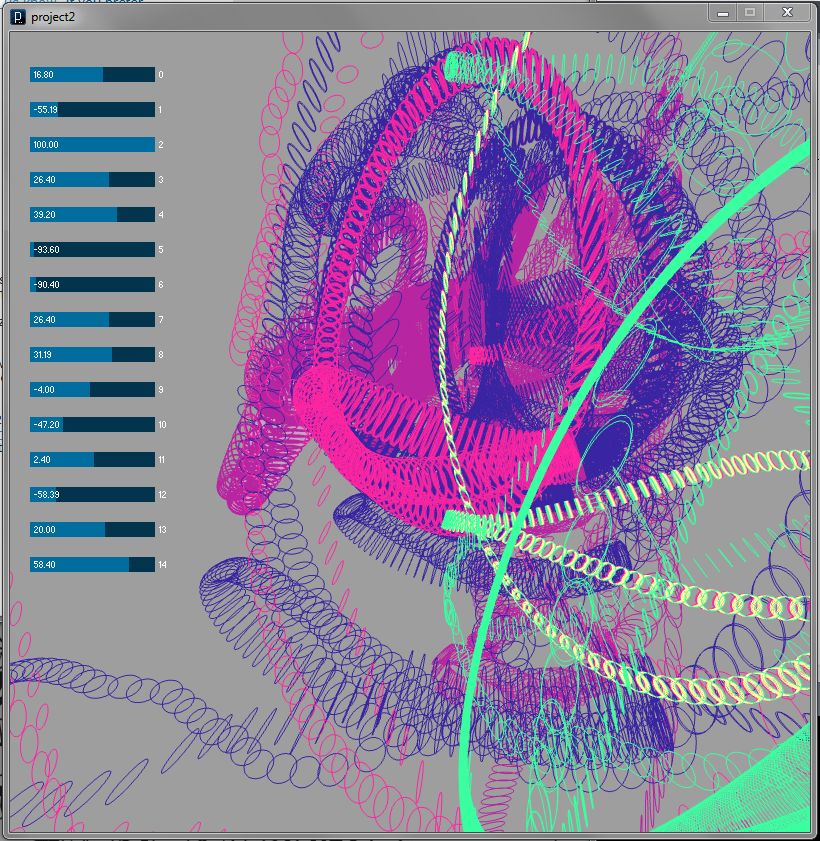
Because this is ultimately intended for use as a performance instrument, I've written it to incude the option to be controlled with a Midi controller as an alternative to the on-screen controllers. This is still under development. Although it currently works with my M-Audio Oxygen49 keyboard, using a different controller would involve reassigning the Midi CC values in the "controls" file. Also, the "note" intervals have not yet been mapped to the Midi keys.
For the required data set, I was looking for something that had the potential to help locate resonant patterns in the elliptical oscillations. I chose to use the energetic states of the hydrogen atom (see http://astro.unl.edu/naap/hydrogen/levels.html .) I set the energy of a single electron at "ground" state to 1 (rather than the SI unit of -13.6 eV) in order to focus on the harmonic properties of the intervals between the states, leaving only the series 1/1, 1/4, 1/9, ..., 1/n^2. These basic "quanta" of energy are the basis for all of the macroscopic structure in the universe, including life, and can be considered truly fundamental; a musical "scale" certainly worth expressing visually. They are mapped to buttons ("keys") laid out along the bottom of the screen. When the speed of rotation is turned all the way up in a given direction (i.e. with the ROTATE X slider,) the ellipse will oscillate with a period of 2pi*1/n^2 per frame, with n determined by the button last clicked.